Option Calculator: Black-Scholes Premium & Greeks Analysis
In the trading and risk management of financial derivatives, accurately evaluating the theoretical value of options is the foundation of all quantitative analysis. The option calculator provided on this page utilizes the standard Black-Scholes Model to help users quickly calculate the fair premiums for European Call and Put options, while simultaneously outputting the corresponding risk sensitivity metrics (Greeks).
Option Pricing Model and Calculator Principles
The underlying computational logic of this calculator is built upon the Black-Scholes pricing model introduced in 1973. This model derives the theoretical price of an option in an efficient market by establishing a risk-free portfolio consisting of the underlying asset and a risk-free bond.
Core Formulas of the Black-Scholes Model
The mathematical formulas used by the system to calculate the theoretical prices of call () and put () options are as follows:
Where and are calculated as follows:
In the formula, represents the Cumulative Distribution Function of the standard normal distribution.
Model Assumptions and Practical Limitations
Before making trading decisions using the theoretical prices generated by this calculator, it is essential to clearly understand the differences between the mathematical assumptions of the Black-Scholes model and the real market. The model assumes that the underlying asset price follows a Geometric Brownian Motion, and that both the risk-free interest rate and the asset's volatility remain constant throughout the life of the option.
In the real market, volatility changes with different strike prices and expiration dates, forming a Volatility Smile or Volatility Surface phenomenon. The calculation results of this tool are suitable for the preliminary valuation of European options (exercisable only at expiration). If evaluating American options or Exotic Options with complex path-dependent features, alternative methods like the Binomial Tree model or Monte Carlo Simulation should be used.
Quants Note Option Calculator User Guide
This calculator interface is built with the SureForms form plugin, combined with background numerical computation scripts to provide real-time interactive calculations and visualized charts. Please configure the following market variables in sequence, and the system will synchronously redraw the pricing model chart at the bottom.
Input Variables Definition
- Spot Price: The current spot trading benchmark price of the underlying asset (e.g., stock, index) in the market.
- Strike Price: The predetermined price at which the option contract agrees to buy or sell the underlying asset in the future.
- Days to Expiration: Directly input the remaining calendar days (e.g., 30). The system's background will automatically perform the annualized conversion calculation (), eliminating the need for users to manually convert decimals.
- Risk-Free Rate: In practice, the US Treasury yield is often referenced. The interface provides a slider dragging function, with a setting range from 1% to 10%.
- Volatility: The annualized standard deviation of the underlying asset's returns. You can input historical volatility or implied volatility derived from market quotes. The interface provides a slider dragging function, with a setting range from 1% to 50%.
- Option Type: Switch between Call or Put options via radio buttons, and the system will instantly load the corresponding Black-Scholes pricing formula.
- Greek Type: In addition to the basic Delta, Gamma, Vega, Theta, and Rho, this system additionally supports the charting of second-order cross-risk parameters Vanna and Volga, allowing advanced traders to evaluate the skewness risk of combined volatility and price movements.
Visualized Output Metrics Analysis
After configuring the parameters, a dual-axis dynamic "Black-Scholes Model" chart will be instantly generated at the bottom of the interface to assist you with Scenario Analysis.
- Theoretical Price Curve (Left Y-Axis): The solid line in the chart (indicated by a blue line) plots the theoretical option premiums corresponding to different underlying prices (X-axis) under fixed volatility and remaining days.
- Greeks Distribution (Right Y-Axis): The dashed line in the chart (indicated by a pink dashed line) presents the values of the risk metric you selected in the Greek Type.
- Position Risk Interpretation: Users can directly observe the risk characteristics of their positions through the chart. Taking the system default screen as an example, when the underlying price (100) equals the strike price (100), the Gamma curve presents a distinct bell shape and peaks at the At-the-Money position. This specifically quantifies the mathematical property that at-the-money options have the highest rate of change in Delta, reminding traders to intensively execute Dynamic Hedging within this range.
Practical Application Scenarios of Risk Parameters (Greeks)
Simply knowing the option price is not enough to construct a complete trading strategy. Professional traders pay closer attention to the profit and loss changes of their positions when market variables fluctuate. If you are interested in the mathematical derivation of Greeks and the mathematical foundation of the Taylor Expansion, please refer to our in-depth technical article: What are Delta, Gamma, and Vega? Understanding Derivative Risk Management through Taylor Expansion.
Evaluating Position Exposures and Hedging Needs
Through the Greeks data generated by this calculator, you can specifically quantify the risk profile of your portfolio. The Delta value indicates the expected change in the option price for every 1 unit change in the underlying asset, which is also the benchmark data for constructing a Delta Neutral hedging strategy. Gamma reflects the rate of change of Delta, helping traders evaluate the frequency and cost of readjusting hedge positions during severe market volatility.
The Vega value shows the impact of a 1% increase in implied volatility on the premium. On the eve of listed companies' earnings releases or the announcement of macroeconomic data, the market typically experiences volatility expansion. At this time, positions with significant Vega exposure will face substantial unrealized profit and loss fluctuations.
System Implementation Details (SureForms Technical Architecture)
The web frontend of this calculator is developed using the SureForms plugin. Unlike traditional WordPress forms that only collect data, we combined SureForms' numerical calculation features with a custom JavaScript math library, encapsulating complex normal distribution integration and Black-Scholes computational logic to be executed on the browser side. This architecture ensures that users receive millisecond-level instant feedback when adjusting parameters, while simultaneously reducing the server's computational load to achieve optimized web performance.
Advanced Quantitative Practice: Building a Dedicated Python Option Computation Engine
The web-based calculator is suitable for rapid preliminary calculations targeting a single strike price or specific market scenario. If your goal is to execute large-scale historical backtesting, build automated Market Making scripts, or simultaneously monitor the overall Greeks exposure of a multi-asset portfolio, you must have an independent programmatic computing environment.
Relying on external web tools cannot meet the low-latency and batch-processing requirements of systematic trading. Quantitative traders typically use programming languages to encapsulate the Black-Scholes and Binomial Tree models into reusable libraries, and connect to broker APIs to obtain real-time quotes, thereby calculating the current Implied Volatility and real-time risk parameters.
The Python Quantitative Option Practice: From Strategy Principles to Visual Backtesting course launched by Academy Q is specially designed for investors with basic programming skills who wish to step into quantitative analysis of financial derivatives.
This course will take you out of static forms and directly into a quantitative development environment:
- Core Model Implementation: Build a Black-Scholes pricing module from scratch using Python, and apply the Newton-Raphson numerical method to reverse-engineer precise implied volatility.
- Data Visualization: Implement 3D Volatility Surface charting to analyze pricing structural anomalies between different expiration dates and strike prices.
- Dynamic Hedging Backtesting: Write a Delta Neutral hedging script, input real market historical data, and evaluate hedging costs and capital Drawdown performance under different market volatility scenarios.
If you are ready to transform option theory into actionable systematic trading logic, please visit the course page to view the complete syllabus and practical project details.
Frequently Asked Questions on Options and Pricing Models (Q&A)
Q1: Why is there a discrepancy between the theoretical premium calculated by the calculator and the actual quotes from the exchange?
The Black-Scholes model assumes constant market volatility, but real market option quotes include traders' expected premiums for future risks. When actual market quotes deviate from theoretical prices, it reflects the market's current expectations of volatility. In practice, quantitative traders will reverse-engineer actual market quotes into the pricing model to derive the Implied Volatility, using it as a benchmark to measure whether an option is relatively expensive or cheap.
Q2: How should the "Risk-Free Rate" parameter be configured in practice?
If you are evaluating US stock or futures options, it is practical to use the US Treasury Bill yield with a maturity similar to the option's remaining days to expiration. For the Taiwan market, you can refer to TAIBOR (Taipei Interbank Offered Rate). It is important to note that for options very close to expiration, sensitivity to interest rate changes (Rho) approaches zero, meaning minor interest rate adjustments have minimal impact on the overall premium.
Q3: Can this calculator be used to evaluate individual US stock options?
The core computational logic of this tool utilizes the standard Black-Scholes model, whose mathematical assumptions only apply to European Options that can only be exercised at expiration (e.g., TXO, SPX index options). Individual US stock options are American Options, which feature early exercise. Using this calculator directly might slightly underestimate their theoretical value. For American options, it is recommended to use the Binomial Tree model for numerical pricing instead.
Extended Financial Analysis Tools
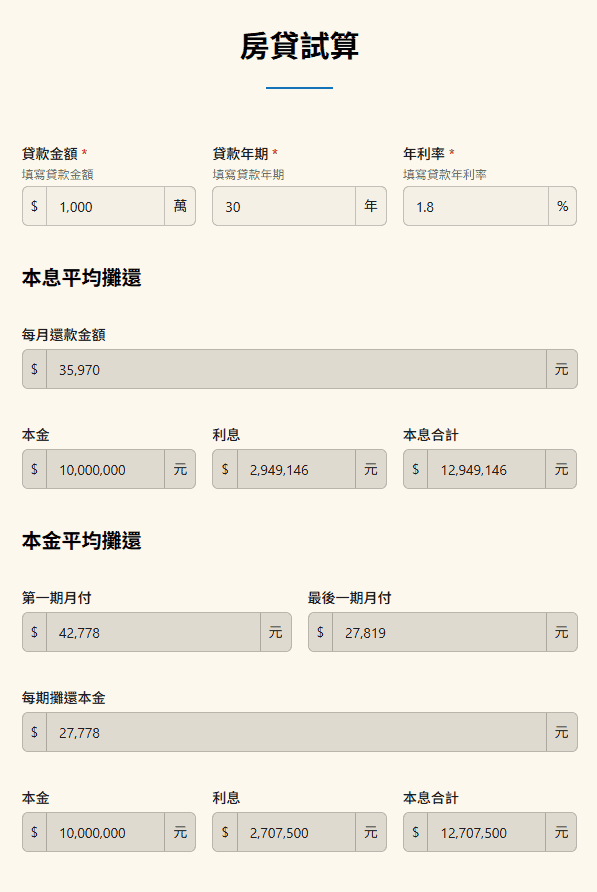
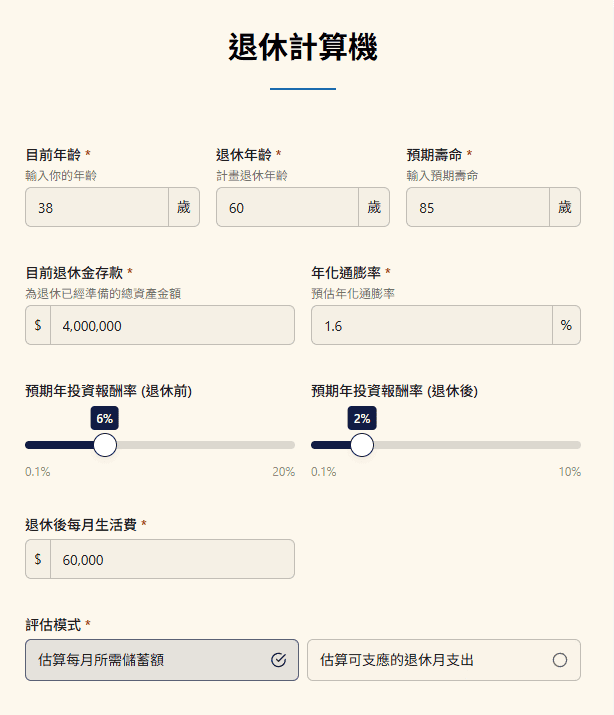
In addition to professional pricing models for financial derivatives, the Quants Note team has also developed various web-based calculators for asset allocation and debt management. All calculations are executed on the browser side to ensure the privacy of your financial data.
- Dollar-Cost Averaging (DCA) Compound Interest Calculator: Supports configuring initial principal, fixed monthly investment amounts, and expected annualized return rate, generating a dynamic asset growth curve. Suitable for index investors evaluating long-term accumulation trajectories.
- Lump-Sum Investment Compound Interest Calculator: Designed for single, large-sum purchase scenarios, specifically breaking down the proportionate structure of principal and compounded interest across different time dimensions.
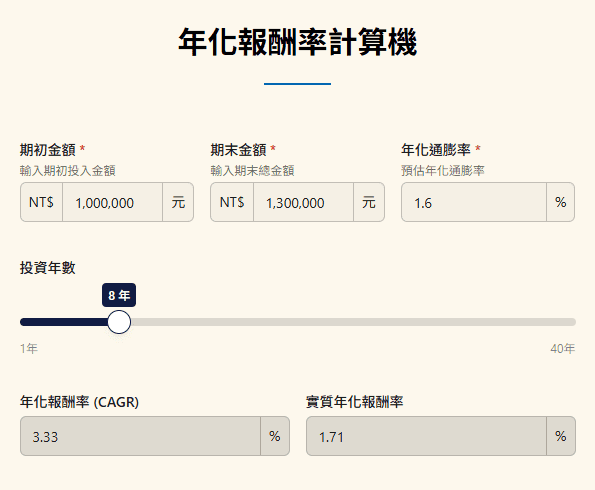
- Compound Annual Growth Rate (CAGR) Calculator: Input the beginning and ending total asset values along with the investment period to accurately reverse-engineer the absolute annualized growth rate of the portfolio, eliminating return rate distortions caused by short-term volatility.
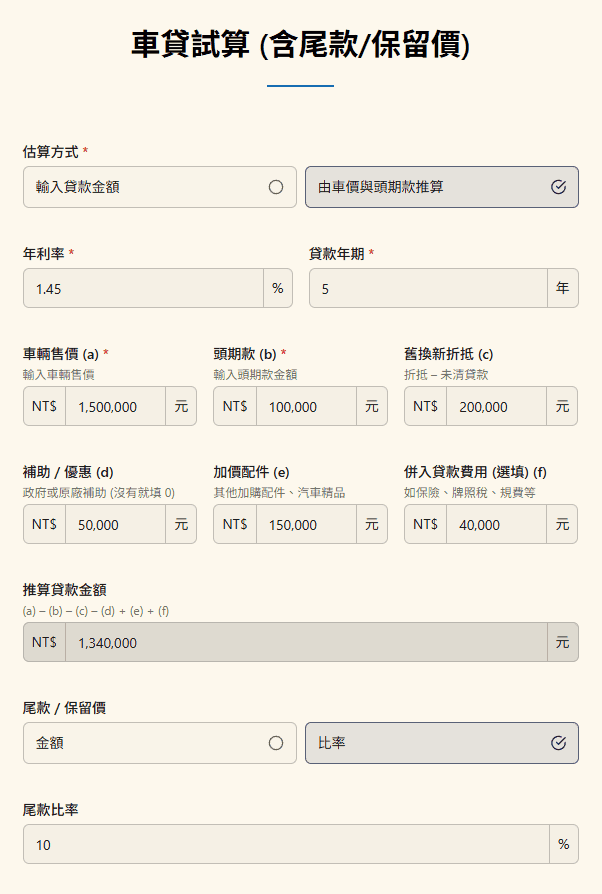
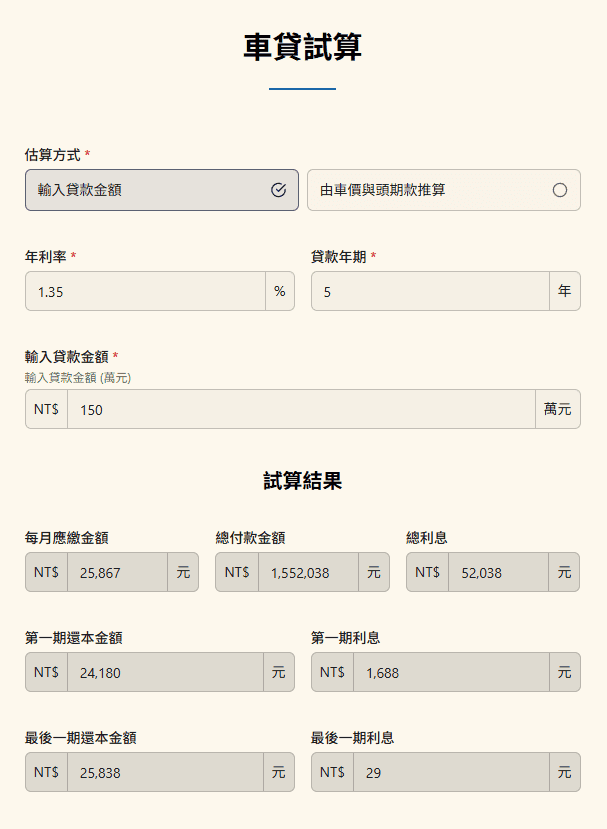
- Auto Loan and Installment Calculator: Input the total loan amount, number of periods, and annual interest rate. The system automatically generates a monthly cash flow breakdown of equal principal and interest amortizations, helping you precisely grasp the cost of debt capital.