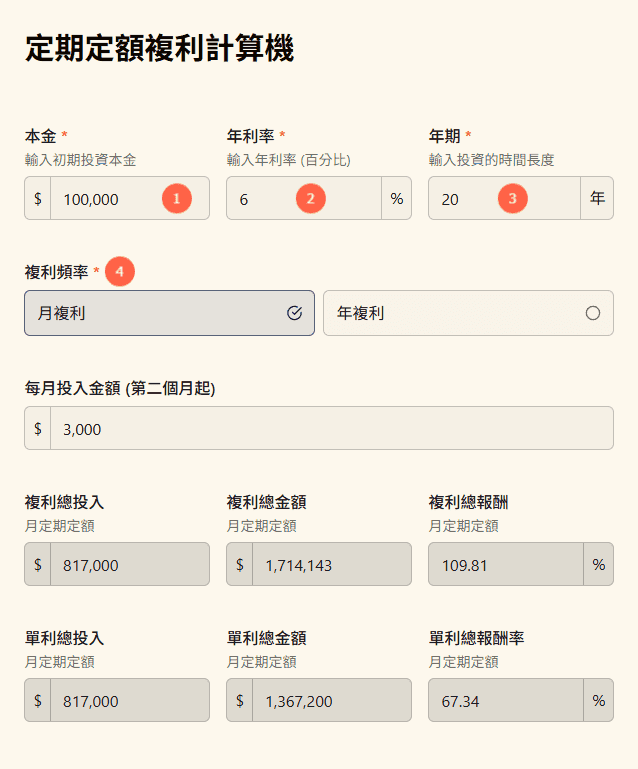
DCA Compound Interest Calculator
Best strategy for smoothing costs and accumulating wealth. DCA (Dollar-Cost Averaging) is an investment strategy to overcome market volatility. By investing a fixed amount at fixed intervals, you buy more units when prices are low, thereby lowering average holding costs. This tool (DCA Compound Interest Calculator) helps you estimate the long-term compound returns of forced monthly savings.
How to use?
Please enter the following values for your simulation:
- Principal: The initial lump sum you intend to invest (e.g., $10,000).
- Annual Rate: Expected annualized return. Reference data: Taiwan Weighted Index averages about 7%~9%, S&P 500 about 8%~10%, while time deposits are about 1.5%.
- Year: The duration of your investment in years (e.g., 20 years).
- Frequency: How often interest is added to the principal. Select "Annually" for general stock investments, or "Monthly" for high-yield savings accounts. Higher frequency results in a stronger compounding effect.
Input numbers to instantly display: Total Invested via DCA, Total Interest, and Total Balance; also provides a Simple Interest Comparison to help you understand the power of compounding and time.
Why choose Dollar-Cost Averaging (DCA)?
The core advantages of the DCA strategy lie in "removing human emotion" and "building discipline":
- No Market Timing: You don't have to worry about whether now is the peak. In the long run, continuous buying effectively smooths out market volatility risks.
- Accessibility: You don't need a large sum to start. Investing 3,000 or 5,000 monthly, combined with time compounding, will form substantial assets after 20 years.
- Smile Curve: If the market falls and then rises, DCA investors can accumulate more shares at low levels, achieving a higher return rate than a lump sum investment when the market recovers.
Calculation Example: The Power of Saving 500 Monthly
Assuming you start at age 25, investing 500 monthly into an index ETF with a 7% annualized return (like 0050 or VOO):
- After 10 years: Total invested 60,000, final asset value approx. 86,000.
- After 20 years: Totally invested 120,000, final asset value approx. 260,000.
- After 30 years: Principal invested 180,000, final asset value approx. 609,000.
Data shows: The longer the time, the higher the proportion of "passive income" from compounding; asset growth speed will far exceed the speed of principal injection in later stages.
Should investment frequency be Monthly or Yearly?
Backtesting shows that for long-term investors, the difference in final return between "Monthly" and "Yearly" contributions is minimal (<0.5%). The key is "consistency" rather than frequency. It is recommended to choose the frequency that best matches your cash flow (e.g., payday) to avoid hesitation caused by manual operations.
Want to know the math?
Behind DCA, the compounding effect is still at work. If you have a large sum of idle cash to invest at once, please refer to our [Compound Interest Calculator: Formula & Lump Sum].
DCA Frequently Asked Questions (FAQ)
Q1: I have a large sum, should I "Lump Sum" or "DCA"?
This depends on your risk tolerance.
- Mathematical Expectation: Historical data shows that since the stock market trends upwards in the long term, Lump Sum has a 67% chance of outperforming DCA.
- Psychological Aspect: DCA avoids the stress of "market crashing right after buying," suitable for conservative investors. If you choose Lump Sum, please switch to our [Compound Interest Calculator] for estimation.
Q2: Is "Monthly" or "Weekly" deduction better for DCA?
In the long run, the difference is negligible. According to S&P 500 backtesting, the difference in annualized returns between weekly and monthly deductions over 20 years is usually less than 0.2%.
The key is "consistency." It is suggested to set up monthly deductions matching your cash flow (e.g., payday); overly frequent operations increase management burden.
Q3: Is DCA still effective if the market keeps falling?
Yes, and this is exactly where the advantage of DCA lies.
When the market falls, a fixed amount buys "more units." When the market rebounds, these units accumulated at low prices will contribute huge profits; this is called the "Smile Curve" effect. The biggest taboo in DCA is stopping contributions during a downturn, as you will miss the opportunity to lower average costs.
Related Tools
Want to compare the difference between Lump Sum and Irregular Contributions? Please use:
👉 Compound Interest Calculator (Lump Sum)
Calculate retirement funds precisely using real rates of return, supporting two scenarios:
👉 Retirement Calculator